Sample Issue
Ray Garnett Climate Letter
Volume 8, Number 7 November 8, 2012
Highlights Since the Last Letter
* Wheat production in the countries of Australia and Argentina is expected to fall 12-15 mln tones below that of a year ago because of drought and excessive rains;
* ACC correctly alerted clients to the risk of Agricultural Drought drought in Australia (Please see forecast verification section); and
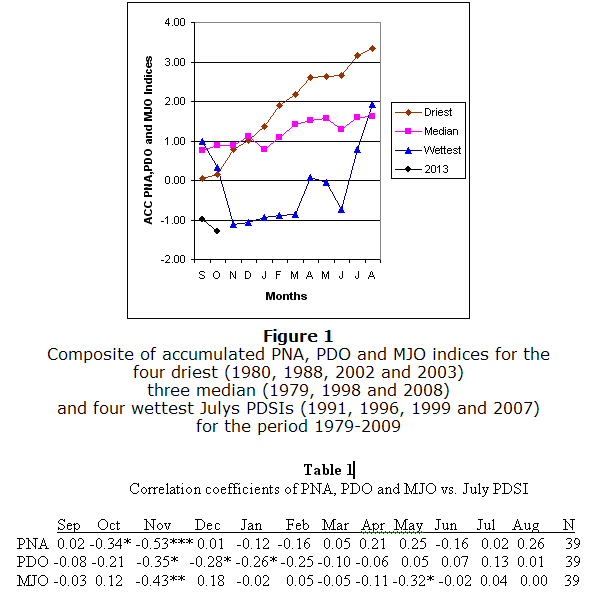
* Based on PNA, PDO and MJO behavior during September and October, earliest indications are for wet conditions next July over the prairies as measured by the Palmer Drought Severity Index (Please see appendix).
Canadian Prairies
Spring Wheat & Canola Regions
*Summary: A lack of fall soil moisture recharge is a concern in Saskatchewan and parts of Alberta.
October 29 to November 4 brought in excess of 200% of normal precipitation to much of the Palliser North and Eastern prairie zones. During October, good recharge rains occurred in the Peace River (339% of normal), Eastern Prairies (166% of normal) and Palliser North at 126% of normal. The Palliser Brown zone was the driest at 66% of normal. Since September 1st, Saskatchewan has received 40-60% of normal precipitation with a secondary area of concern existing between Calgary and Edmonton.
U.S.
Corn, Soybean and Wheat Regions
Summary: Recent behavior of the El Nino/Southern Oscillation phenomenon suggests a break in drought conditions in the southern hard red winter region.
October 21-31 brought much above normal rains to Ohio where corn and soybean harvesting is behind the national average. Dry weather persisted in the hard red winter wheat region. Since September 1st, soil moisture recharge is lacking in Oklahoma and south- central Kansas.
At October 1st, 88% of the hard red winter wheat crop was planted and 73% emerged. Seventy-seven of the crop is rated in fair to good condition compared to 81% a year ago.
Risk Assessment
Based on a SOI index consistently near zero during September and October, there are 2:1 odds that rainfall will exceed the median in much of Texas during November to January.
Other Global Impacts
Argentina - Wheat Region
Summary: Excessive rains are adversely affecting quality and yields.
October 21-31 rains in excess of 200% of normal (over 100mm) pounded many key growing areas during the heading stage contributing to water logging and diseases.
A direct look at crop conditions with remotely sensed data reveals below average plant vigour in over 90% of the growing region.
ACC has lowered its forecast to 10.8 mln tonnes (3.80 mln ha*2.85 t/ha) and expects the USDA to do likewise in their November estimate.
Europe: Wheat Region
Summary: Soil moisture recharge this fall has been fair to good in leading producers of France and U.K.
Rains of 50-150 mm October 21-31 in Spain and most of Eastern Europe helped recharge soil moisture on one hand while delaying planting on the other. Soil moisture recharge has been inadequate in eastern Germany and Poland this past fall. Planting of wheat in France, the largest producer, is about two-thirds complete.
FSU: Wheat Region
Summary: Soil moisture recharge for 2013 crop has far from ideal, especially in the Siberian sector.
October 21-31 brought will above normal rainfall to almost the entire European sector recharging soil moisture conditions for winter grains planted mid August to mid October. Soil moisture recharge since September 1st has been highly variable in the European sector and very poor in the Siberian sector.
The snow line is running north of the Ukraine.
Australia - Wheat Region
Summary: Yield prospects continue to decline.
October 21-31 brought more dry weather to the continent, further reducing yield prospects. During October, a key month for establishing yield, precipitation was less than 50% of normal. Hardest hit are Western Australia and New South Wales that produce 65% of the wheat crop. Only Victoria, which contributes 12%, appears to have better yields than a year ago.
ACC forecasts wheat production at 18.8 mln. tones (13.3 mln ha*1.42 t/ha). The USDA is expected to drop the November estimate below their October estimate of 23.0 mln tones.
Forecast Verification
On August 9th we wrote for Australia: "Based on SOI behavior during June and July, the odds are 2:1 that rainfall will exceed the median in central New South Wales during August to October of 2012. Odds are lower in remaining grain-growing areas. This is a wheat exporter to watch, especially if El Nino develops and strengthens in future months."
What happened?
Nino 3.4 sea surface temperature anomalies during the months of August, September and October were: 0.73, 0.51 and 0.29 respectively.
August brought very weather apart from relief in Victoria August 11-20. September was also very dry except for widespread relief September 21-30 in New South Wales and Western Australia. October brought less than 50% of normal rainfall to the wheat-growing region.
Appendix
Figure 1 below shows the profiles of accumulated PNA, PDO and MJO indices leading up to the critical July period over the Canadian prairies. The July Palmer Drought Severity Index (PDSI) is being used a measurement of July dryness based on a supply and demand model of soil moisture. Earliest indications point to wet conditions next July. The correlation coefficients in Table 1 below show that the signal is strongest during the October through January period.
Solar Activity
During September and October there has been an average of 58 sunspots per month, which is below the average of 60. An Australian solar modeler is predicting solar activity to peak in the current sunspot cycle (Cycle 24) this winter at 90 sunspots a month. We are currently in year 4 of the 11 year sunspot cycle. The 11-year sunspot cycle typically peaks in year 4 and then commences a 7year decline. Below normal solar activity is associated with cloudier and cooler than normal weather over the prairie region.
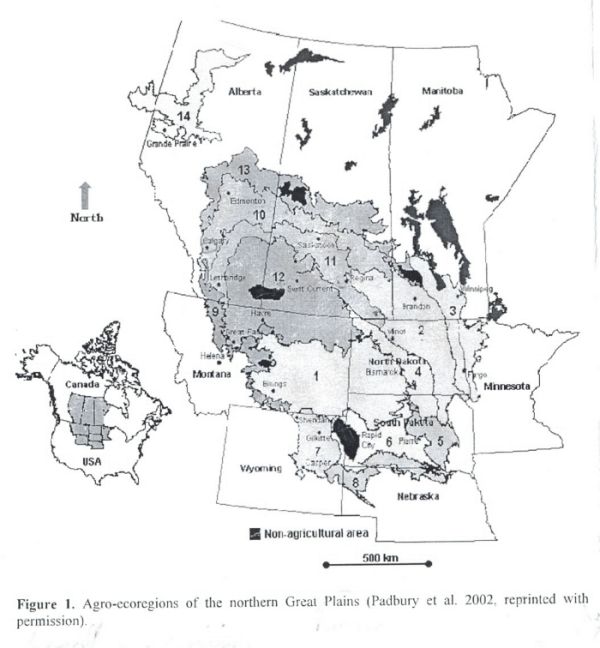
Following is a map showing the makeup of Four Agro Ecological Zones:
Peace River: Agro-eco region #14
Palliser North: Agro-eco regions #13, 10 and 11
Palliser Brown Soil: Agro Eco region #12
Eastern Prairies: Agro Eco region #2 and #3
Glossary of Terms Used
Agricultural Drought: The U.S. Centre for Climate and Environment Assessment defined drought as less than 50% of normal rainfall during two consecutive months of the active growing season in unirrigated areas. Using the Canadian prairies as an example, areas that receive less than 50% of normal rainfall during June-July typically would be considered drought affected. One cannot ignore the significance of July precipitation in defining agricultural drought on the Canadian prairies. Also, when yield departures from trend are greater than 10% below trend, ACC considers it an Agricultural Drought.
AO: The Arctic Oscillation (AO) consists of 1000 mb height anomalies centred over the Bering Sea and northwest of Spain with an associated trough over the Arctic. When the oscillation is strong (Blue or of a negative sign as seen on the Climate Prediction website) there are increased and more intense cold air incursions into the Canadian prairie region. The reverse is true when the index is positive.
AP: The AP Index (AP) is a measure of the general level of geomagnetic activity over the globe for a given day. It is derived from measurements made at a number of stations world-wide of the variation in the geomagnetic field due to currents in the earth's ionosphere and to a lesser extent, in the earth's magnetosphere. Offical values of the AP Index are calculated twice a day by an observatory in Niemegh, Germany.
Bermuda High: Has been described as an extension of the Azores High a key aspect of the North Atlantic Oscillation (NAO), which is more expansive when the NAO is positive. Agro Climatic Consulting (ACC) contends that a positive NAO tends to prevent moisture from entering North America through the Gulf of Mexico.
Eastern Prairies (EP): East of a line between Coronach, Saskatchewan and Swan River, Manitoba
ENSO: El Nino/Southern Oscillation (ENSO) in combination with the Indian monsoon system constitutes the largest single source of inter annual climatic variability on a global scale with effects that are wide-ranging and often severe. The Southern Oscillation is the difference in sea level pressure between Darwin and Tahiti. A positive (negative) SOI is indicative of La Niña (El Niño) conditions colder (warmer) than normal sea surface temperatures in the east equatorial Pacific. The Nino 3.4 region is most commonly used.
Bjerknes in the late 1960s fused the southern oscillation (SOI) concept with that of warmer or colder than normal sea surface temperatures in the east equatorial Pacific. Hence, the phenomenon is called the El Nino/Southern Oscillation. Research has shown that El Niño (La Niña) conditions during the spring and summers months are favourable (unfavourable) for rainfall on the Canadian prairies.
MJO: The Madden Julian Oscillation (MJO) is a 30-60 day intra seasonal oscillation (a six week cycle) which travels eastwards at approximately 13 mi/hr (6 m/sec) through the atmosphere over the Indian and Pacific Oceans. A wet phase of enhanced precipitation follows a dry phase where thunderstorm activity is suppressed.
The proposed mechanism is complicated. It is hypothesized, for example, that a positive MJO in February at 120° W. (near the North American west coast) appears to suppress June-July precipitation over the Canadian prairies months related to a six-week periodicity. The wettest time of the year over the prairies is around June 21st at high sun when a trough normally occurs on the west coast as part of the annual cycle. A repetition of the MJO six-week cycle around June 21st would serve to force a ridging pattern that acts against normal troughing associated with the annual cycle resulting in drier June-July.
Modified PNA Accumulation Approach sums only statistically significant months of December, January and May are summed. The sign of the May PNA values is reversed in the summation consistent with capturing sustained forcing.
NAS: The North America snow cover (NAS) represents the areal extent of snow cover in North America.
NAO: The North Atlantic Oscillation (NAO) is calculated as the difference in surface pressure between The Azores High (which is about 50 degrees latitude west of Gibraltar) and Iceland. A positive index shows a stronger than usual high near the Azores Island and a deeper than normal Icelantic low.
NP: The North Pacific Index (NP) is the area weighted sea level pressure over the region 30ºN -65ºN, 160ºE-140ºW. When this pressure is lower than normal December to August it is conducive to drought.
PDO: The Pacific Decadal Oscillation (PDO) is a long-term ocean temperature fluctuation in the Pacific Ocean, which waxes and wanes about every 20-30 years. When the index is positive the west pacific becomes cool and a wedge in the east warms. The pattern reverses with a negative PDO. A google search will provide more information.
PDSI: The Palmer Drought Severity Index (PDSI) is often used as a measurement of dryness and is based on a supply and demand model of soil moisture. Minus 2 is moderate drought, minus 3 severe drought and minus 4 severe drought. Categories are as follows:
Extremely wet          > 4
Very wet           3.00 to 3.99
Moderately wet     2.00 to 2.99
Slightly wet       1.00 to 1.99
Incipient wet      0.50 to 0.99
Near Normal        0.49 to -0.49
Incipient Drought -0.50 to -0.99
Mild Drought      -1.00 to -1.99
Moderate drought  -2.00 to- 2.99
Severe drought    -3.00 to - 3.99
Extreme drought      < -4.00
The Palliser Brown Soil Agricultural Acological Zone is bounded by Lethbridge, Red Deer, Regina and the Canada-U.S. border. It is found well within the 'Palliser Triangle' and is traditional considered the driest zone of the Canadian prairies.
The Palliser North Agricultural Ecological Zone is located in the northwestern prairies, essentially north of the Palliser Brown Soil zone. It is found west of Lethbridge, north of Red Deer and Regina and northwest of Regina and Swan River. Its delineation is based on the work of Padbury et al in 2002 and is one of four Ag Eco Zones defined in the NRI-MRAC research project.
PNA: The Pacific North American Teleconnection Index (PNA) is a derivative index of the El Niño/Southern Oscillation index and is typically positive during El Nino and negative during La Nina. A positive (negative) PNA pattern is indicative of a strong (weak) Aleutian Low influence, which in turn forces a ridge (leads to Siberian expresses) over the prairie region. A positive (negative) PNA pattern is associated with mild (cold) winters over the Canadian prairies. During the April to July period research has shown that zonal flow is associated with wetter cooler weather while meridian flow is associated with drier hotter weather over the North American Great Plains.
QBO: The Quasi-Biennial Wind Oscillation (QBO) often referred to as the stratospheric wind reversal was discovered in the early 1960s. Measured at Singapore it is a reversal in winds at the top of the atmosphere blowing one direction for about 13 months and then reversing. It is an important factor in foreshadowing Indian monsoon rainfall and recently demonstrated as a factor determining Canadian prairie rainfall. The strength of the QBO is measured at various levels of atmospheric pressure with the 30 and 50mb levels most commonly used.
SOI: The Southern Oscillation Index (SOI) represents the difference in sea level pressures between Darwin and Tahiti, which are the central points in a planetary seesaw of sea level pressures discovered by Sir Gilbert Walker in the early part of the 20th century. When the index is positive (negative) it is an indication of La Nina (El Nino). La Nina (El Nino) describes cooler (warmer) than normal sea surface temperatures in the central and east equatorial pacific.
SSTA: Sea Surface Temperature Anomaly
SSA: Solar Influence (SSA) represents sunspot anomaly and is the departure from normal in sunspot activity. For example SSAJAN stands for the sunspot anomaly in January Sunspot activity modulates the solar influence whereby low (high) sunspot activity increases (decreased) cosmic rays, ions, condensation nuclei and clouds on a global scale. Solar irradiance is reduced (increased) with low (high) sunspot activity and surface temperatures tend to be lower (higher). It has been demonstrated that cloudiness over the over the oceans can vary up to 5% between low (20 sunspots per month) and high (150 sunspots per month) sunspot activity. A cloudier earth is shinier, cooler and wetter earth. Solar irradiance is also reduced (increased) with low (high) sunspot activity and surface temperatures tend to be lower (higher).
SD: Standard Deviation (SD) is a measure of the 'spread' of values in a frequency distribution. In a normal distribution, the probability that a value will be between the limits of one standard deviation is 68% with a 32% probability of it being in one of the tails of the distribution.
WP: Western Pacific Teleconnection Index (WP) is a primary mode of low-frequency variability over the North Pacific in all months in which during winter and spring, the pattern consists of a north-south dipole of anomalies, with one centre over the Kamchatka Peninsula and another broad centre of opposite sign covering portions of southeastern Asia and the western subtropical North Pacific. A third anomaly centre is located over the eastern North Pacific and southwestern U.S. in all seasons. Therefore, strong positive or negative phases of this pattern reflect pronounced zonal and meridional variations in the location and intensity of the entrance region of the Pacific (or East Asian) jet stream.
Copyright 2012. All rights reserved.
The Ray Garnett Climate and Crop Letter is published 23 times per year (twice monthly) by Agro-Climatic Consulting, 767 Garfield St N, Winnipeg, Manitoba R3G 2M4.
Tel: 204-775-3614; E-mail: ergarnett@shaw.ca
Subscription rate for the Ray Garnett Climate and Crop Letter is $195 per year or $65 for three months.
Created: July 26, 2005
Last Modified: July 28, 2005
The Canadagrain web site is designed & maintained by Branscombe Consulting.